Transform Data into Impactful Stories with Excel Mastery in just 1 day
This course equips professionals with the skills to design and produce visually impactful infographics and data visualisations using Microsoft Excel. Participants will learn advanced tools and techniques to clean, process, and organise data, enabling them to create compelling visuals tailored to client and stakeholder needs. Through hands-on training and practical exercises, learners will master the art of communicating data-driven insights effectively.
KEY LEARNING OUTCOMES
Upon completion of this course, participants will be able to:
- Use Excel tools to clean and process data for visualisation and presentation.
- Apply statistical and graphical analysis to create meaningful infographics.
- Develop aesthetically appealing visuals using data narratives and storytelling methodologies.
- Communicate insights effectively to clients and stakeholders.
WHY CHOOSE THIS COURSE?
- Hands-on training with real-world datasets to enhance practical skills.
- Suitable for professionals across various sectors, including retail, analytics, and business intelligence.
- Taught by experienced trainers with industry-relevant knowledge.
WHO SHOULD ATTEND?
- Retail Executives, Merchandising Analysts, Sales Analysts, Inventory Analysts, Marketing Analysts, Supply Chain Analysts, Business Intelligence Analysts and Professionals in the E-commerce.
COURSE DETAILS
Duration: 16 Hours
Language: English
Delivery Mode: Synchronous e-learning
Location: Online
Course Schedule: 09/04/2025
ENTRY REQUIREMENT
- Age 21 years or above with at least 2 years of work experience in an associate or assistant role.
- Proficiency in English
- Proficient working knowledge of Microsoft Excel.
CERTIFICATION
Participants who successfully complete the
course and assessments will receive a Certificate of Completion.
Course Fees
| LEARNER CATEGORY | SINGAPORE CITIZEN 21 – 39 YEARS OLD | PR ≥ 21 YEARS OLD | SINGAPORE CITIZEN ≥ 40 YEARS OLD |
| Full Course Fee (Incl. 9% GST) | $523.20 | $523.20 | $523.20 |
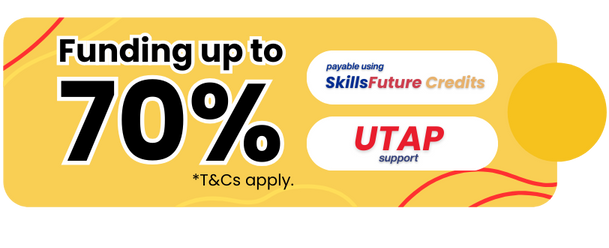
| Training Grant (Up to 70% Funding) | -$240.00 | -$240.00 | -$336.00 |
| Net Amount Payable (Incl. 9% GST) | $283.20 | $283.20 | $187.20 |

UTAP – Get up to 50% Nett Course Fee support as an NTUC Member!
| Excel for Infographics & Data Visualisation (Classroom & Practical training) |
|
| Course ID | TGS-2023022185 |
| Available until | 14-06-2027 |
